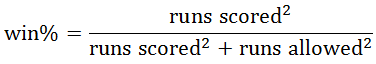
to get that team's projected winning percentage, which, when applied to 162 games, gives that teams projected wins (and losses) for the year.
This year, I took it one step further and have tried to predict the standings for the entire NL. Below are the results:
| Runs | Runs | Projected | Projected | ||
| NL East | Scored | Allowed | Wins | Losses | Win % |
| Washington | 716 | 604 | 95 | 67 | 0.586 |
| Atlanta | 717 | 616 | 93 | 69 | 0.574 |
| Philadelphia | 680 | 625 | 88 | 74 | 0.543 |
| New York | 649 | 667 | 79 | 83 | 0.488 |
| Miami | 622 | 710 | 70 | 92 | 0.432 |
Runs | Runs | Projected | Projected | ||
| NL Central | Scored | Allowed | Wins | Losses | Win % |
| Cincinnati | 743 | 605 | 97 | 65 | 0.599 |
| Milwaukee | 779 | 683 | 92 | 70 | 0.567 |
| St. Louis | 733 | 653 | 90 | 72 | 0.556 |
| Pittsburgh | 696 | 703 | 80 | 82 | 0.494 |
| Chicago | 643 | 688 | 76 | 89 | 0.469 |
Runs | Runs | Projected | Projected | ||
| NL West | Scored | Allowed | Wins | Losses | Win % |
| LA Dodgers | 741 | 619 | 95 | 67 | 0.586 |
| SF Giants | 697 | 619 | 91 | 71 | 0.562 |
| Arizona | 729 | 668 | 88 | 74 | 0.543 |
| SD Padres | 730 | 715 | 83 | 79 | 0.512 |
| Colorado | 760 | 774 | 79 | 83 | 0.488 |
This is not an exact science, as you cannot account for injuries, breakout stars, etc. But it should give you a feel for who are the best teams (and worst teams) on paper. For those of you wondering (and for a bit of perspective), here is what I came up with last year for the projected NL Central standings, with the actual results shown below.
| 2012 Projected Results | Projected Runs | Projected Runs | Projected | Projected | |
| NL West | Scored | Allowed | Wins | Losses | Win % |
| Milwaukee | 761 | 653 | 93 | 69 | 0.574 |
| Cincinnati | 754 | 675 | 90 | 72 | 0.556 |
| St. Louis | 716 | 657 | 88 | 74 | 0.543 |
| Pittsburgh | 662 | 722 | 74 | 88 | 0.457 |
| Chicago | 666 | 732 | 73 | 89 | 0.451 |
| Houston | 629 | 721 | 70 | 90 | 0.432 |
2012 Actual Results | Actual Runs | Actual Runs | Actual | Actual | |
| NL West | Scored | Allowed | Wins | Losses | Win % |
| Cincinnati | 669 | 588 | 97 | 65 | 0.599 |
| St. Louis | 765 | 648 | 88 | 74 | 0.543 |
| Milwaukee | 776 | 733 | 83 | 79 | 0.512 |
| Pittsburgh | 651 | 674 | 79 | 83 | 0.488 |
| Chicago | 613 | 759 | 61 | 101 | 0.377 |
| Houston | 583 | 794 | 55 | 107 | 0.340 |
As you can see, only the Cardinals record was predicted accurately and even then, if you use their actual runs scored and given up, the Pythagorean wins would have been 93. However, other than Milwaukee, this methodology got the standings pretty much in the correct order. So, take this for what its worth, but its a fun exercise to try (if you've got the time).
No comments:
Post a Comment